Quantitative Research
Using survey data to examine online harassment, protective strategies, and support-seeking behaviour.
Context
Context & Design
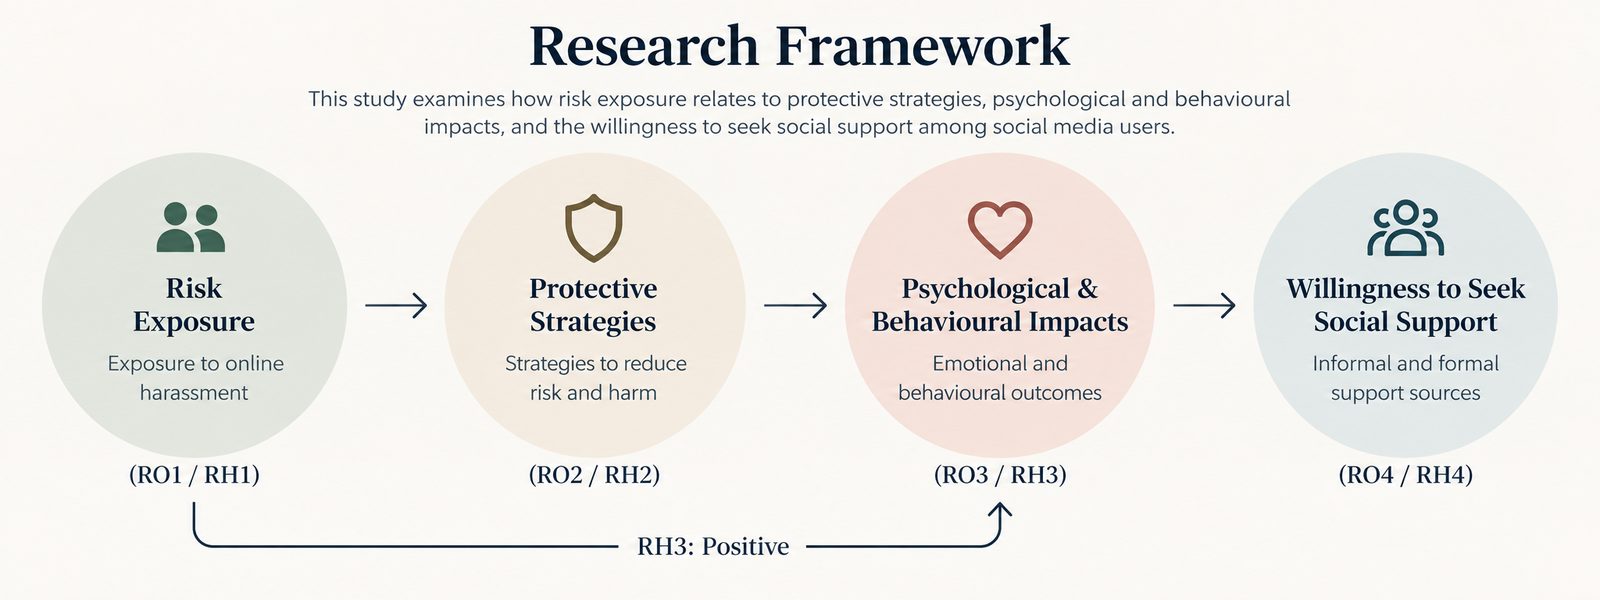
This quantitative cross-sectional study examined social media users' experiences with online harassment, protective strategies, psychological and behavioural impacts, and willingness to seek social support.
The study analysed 407 valid responses from an online self-administered survey.
- Valid Responses
- 407
- Analytical Dimensions
- 4
- Analysis Tool
- SPSS
- Survey Design
- Cross-sectional
From survey data to evidence.
Normality tests showed that all four composite variables significantly departed from a normal distribution. Median and interquartile range were therefore used as the primary descriptive statistics, followed by median-based classification and hypothesis testing.
- Survey Data
- Data Screening
- Normality Testing
- Median / IQR
- Median Split
- Chi-square Tests
- Logistic Regression
- Interpretation
Four Analytical Dimensions
RH2 Protective Strategies was my primary responsibility; the four dimensions together form the full research map.
- RH1Risk Exposure
- RH2Protective Strategies
- RH3Psychological & Behavioural Impact
- RH4Willingness to Seek Social Support
Protective Strategies: Core Finding
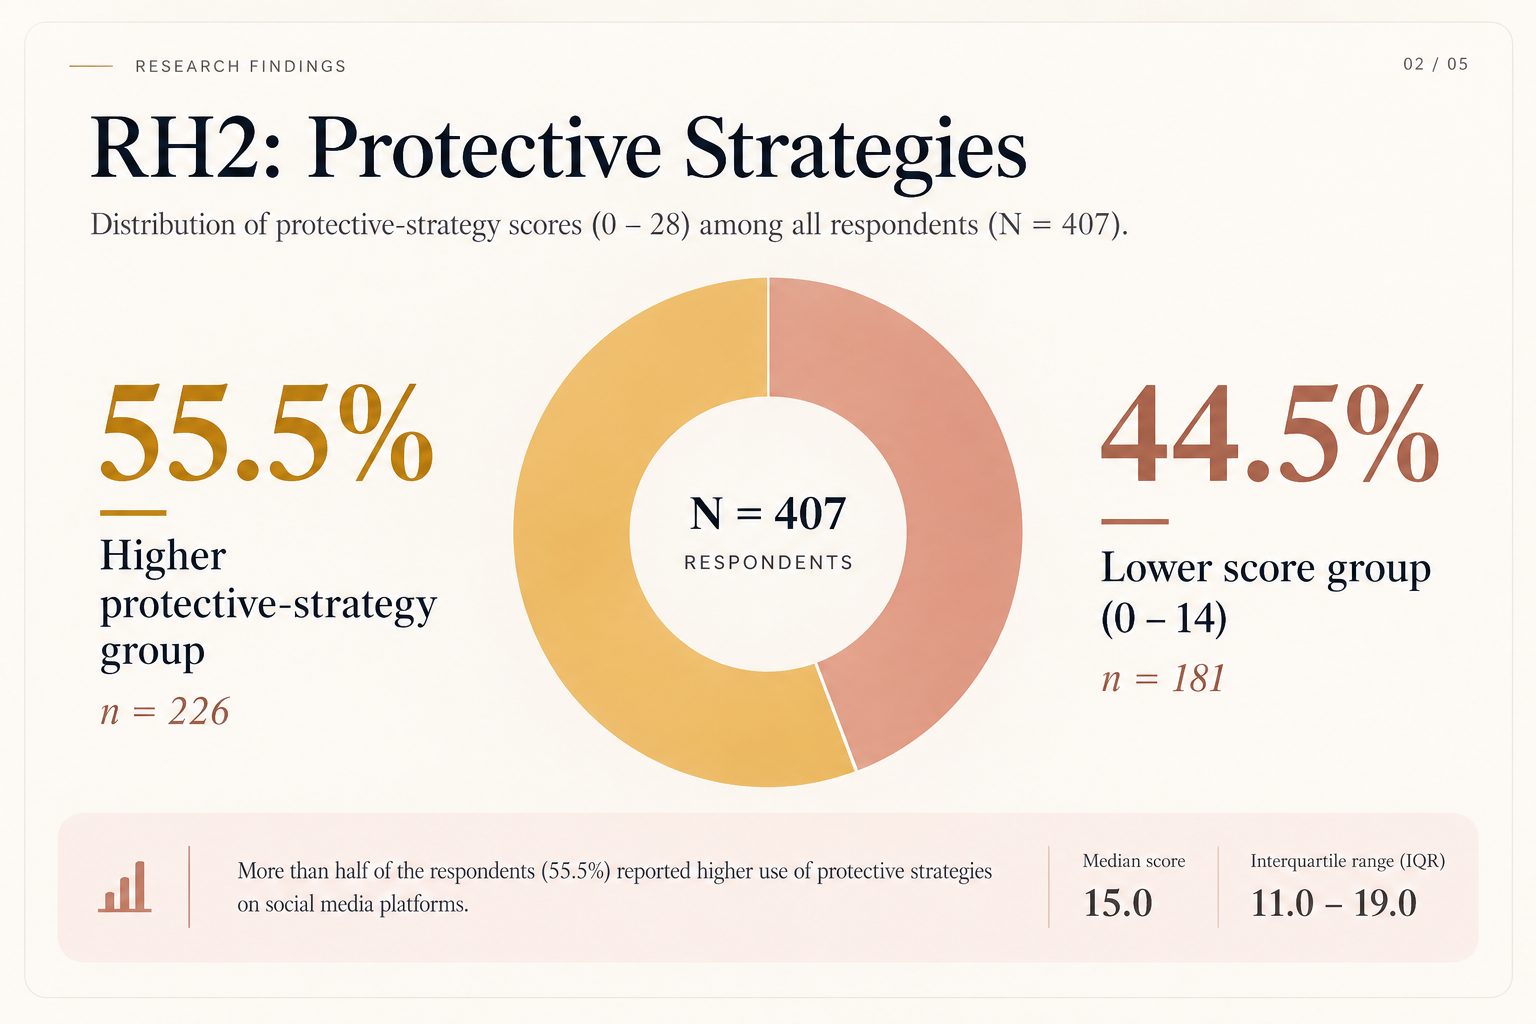
The median protective-strategy score was 15.0, with an interquartile range of 11.0–19.0.
Using the sample median as the classification threshold, 55.5% of respondents were classified into the higher protective-strategy group, while 44.5% were in the lower group.
15.0
11.0 – 19.0
Commonly adopted strategies
Share of respondents who “often” or “always” use each strategy.
- Adjusting privacy settings63.4%
- Blocking, muting or reporting62.4%
- Limiting personal information61.9%
- Using anonymisation tools47.9%
Key Findings Across the Study
- RH1Risk Exposure55.0% were classified into the higher risk-exposure group.
- RH2Protective Strategies55.5% were classified into the higher protective-strategy group.
- RH3Psychological & Behavioural ImpactHigher risk exposure significantly predicted greater psychological and behavioural impact. AOR = 2.43, 95% CI [1.59, 3.73], p < .001.
- RH4Willingness to Seek Social SupportPsychological and behavioural impact was not a significant independent predictor after adjustment. AOR = 1.33, 95% CI [0.87, 2.03], p = .190.
Key Insight
AOR = 1.70
Protective strategies significantly predicted higher willingness to seek social support — higher protective-strategy levels were significantly associated with greater willingness to seek support.
Reflection
Quantitative research is not simply about running statistical tests. It is about choosing an analytical approach that fits the data, interpreting results carefully, and translating statistical patterns into meaningful insights.